In any financial market, the overall price trend is a reflection of how the investors or traders participating in the market feel about it. This is known as market sentiment. To gain an edge in the market, you need to understand market sentiment, as it is considered a powerful tool that can give you an idea of where the market is heading so you can capitalize on potential direction changes. So what is market sentiment and how do you trade with it? In this article, we will explore market sentiment meaning and how to leverage it in trading.
Market Sentiment: Meaning and Definition
To truly understand why this concept is important let’s begin with market sentiment meaning. Also known as investor sentiment, market sentiment refers to the general attitude or outlook of investors towards a particular security or the market as well. It is either a sense of optimism or pessimism and it dictates the overall price trends in the market.
Based on this market sentiment definition, we can infer just how important market sentiment is to forex trading. Market sentiment is the reason investors have opportunities to trade in the first place. It drives demand and supply, which in turn leads to upward or downward price movements.
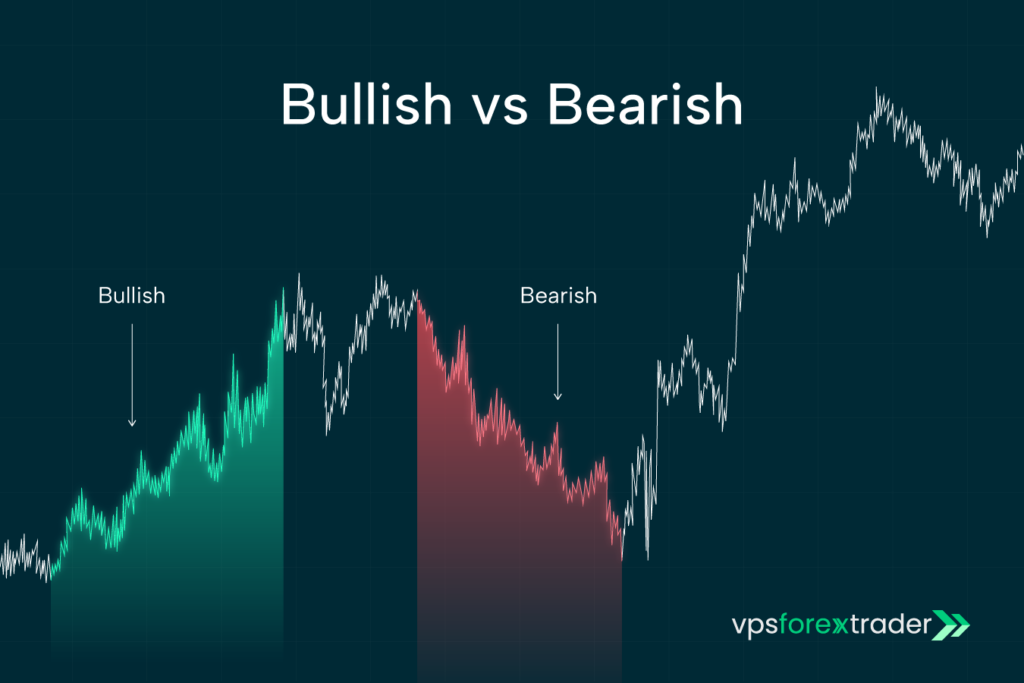
Bullish vs. Bearish Sentiment: What They Indicate
The sentiment in any market is typically described as either bullish or bearish. When the market has a bullish sentiment, it means stock prices are rising and investors are optimistic about the asset’s value which causes them to buy more.
On the flip side, a bearish sentiment means prices are going down. Consequently, investors and forex traders are selling more than they’re buying. This combination of low demand and high supply makes investors take a defensive position to protect their investments.
Tools and Indicators for Analyzing Market Sentiment
Investors often use indicators to measure market sentiment in order to identify the best stocks to trade and potentially favorable opportunities that they can take advantage of. Note that sentiment indicators are typically not used alone. These indicators are typically used alongside other technical and fundamental analysis tools. Here are some of the most widely used indicators for stock sentiment analysis.
- Commitment of Traders (COT): The COT is a market sentiment indicator published by the Commodity Futures Trading Commission (CFTC) on Friday of every week. It shows how the biggest traders in the market, which includes banks, corporations, and hedge funds are positioned. Using this report, investors can determine how these big traders are committed to the current market trends. For instance, if the COT shows a shift in trader attitude towards a bearish sentiment in a market that has been bullish so far, then a trend reversal might be imminent.
- Volatility Index (VIX): this indicator is also called the fear index and it measures the implied volatility of a commodity by tracking options prices. This is why it is considered a useful tool for determining the present and historical sentiments in the market. Investors use options prices to protect themselves against potential price correction. A high implied volatility means there’s a high likelihood that the current trend will change.
- High/low Sentiment Ratio: this is one of the easiest ways to determine if the market sentiment is bearish or bullish. This indicator compares the number of stocks heading to their highest levels to the number heading toward the low within a 52-week period. A prevalent low means the market is bearish while a prevalent high means the bulls are winning.
- Bullish Percentage Index: This is an investor sentiment index that measures how bullish the market currently is using point and figure buy signals. The index measures the amount of stocks that have generated a buy signal. This is expressed as a percentage and individual investors apply a specific threshold to determine if the market is undersold or oversold. Generally, 70 to 80% of stocks having a buy signal suggests that the market is overbought and may likely enter a downturn soon.
- Put/call ratio: this indicator weighs the number of put options against the number of call options. If this ratio is less than one, then more call options are being placed which means investors expect the price to rise. Similarly, a ratio above one means investors expect the market to fall.
How Investor Sentiment Impacts Market Trends
Investor sentiment drives demand and supply in financial markets. This is what leads to price movements in any direction and determines the overall market trend. When the market is in an uptrend, the investor sentiment is bullish. Conversely, when prices are in a downtrend, then the investor sentiment will be bearish. Investors can do a market sentiment analysis by combining the stock market sentiment indicators with other trading frameworks to refine when to enter or exit trading positions.
Stock Sentiment Analysis: Why It Matters
Sentiment analysis is an important tool that helps investors gain valuable insight into the overall forex market outlook and the likely behavior of investors. Some of the potential benefits of analyzing market sentiments in Forex trading include:
- It helps traders understand the overall sentiment, providing context for interpreting other chart patterns or technical indicators.
- Stock sentiment analysis can be used to predict trend reversals which happens when markets become oversold or overbought.
- A divergence between sentiment and price action revealed through stock sentiment analysis could show when an asset is vulnerable to a pullback.
- Sentiment analysis will provide context into herd behavior and crowd emotions. This helps to determine the sustainability of current trends.
How to Use Market Sentiment in Your Trading Strategy
The most common way a sentiment trader would use sentiment is to trade in line with the prevailing market sentiment. This strategy is particularly effective for long-term investors. With investor sentiment analysis, you can determine if the market sentiment is bullish, which means prices are expected to rise. Such markets present a high potential for capital gains and steady dividend income.
However, you don’t necessarily have to trade in line with the herd instinct. Some investors trade against the current market sentiment. For instance, in bearish markets, you could look for beaten-down stocks with strong fundamentals to buy. Such stocks offer great growth potential when prices reverse in the future.
Variety of Sentiment Indicators
Understanding market sentiment is more than just recognizing whether traders are bullish or bearish – it’s about measuring it. Professional traders use a range of sentiment indicators to quantify crowd behavior, assess risk levels, and identify potential turning points in the market.
Here are some of the most widely used tools and how they can improve trading decisions:
1. Put-Call Ratio (PCR)
- What It Measures:
The ratio of put options (bets on price declines) to call options (bets on price increases). - How to Read It:
- High PCR (>1.0): More puts than calls → Bearish sentiment dominates.
- Low PCR (<0.7): More calls than puts → Bullish sentiment dominates.
- Why It Matters:
Extreme readings can signal contrarian opportunities:- When the market is overly bearish, a rebound often follows.
- When optimism is too high, risk of a correction increases.
- Example:
Before the 2020 COVID rebound, PCR spiked to historic highs, signaling panic selling – a contrarian buy signal for savvy traders.
2. VIX – The Volatility Index (“Fear Gauge”)
- What It Measures:
The expected volatility of the S&P 500 over the next 30 days, based on options pricing. - How to Read It:
- Low VIX (<15): Market confidence, calmer conditions.
- Moderate VIX (15–25): Normal range, balanced sentiment.
- High VIX (>30): Rising fear and uncertainty.
- Why It Matters:
A rising VIX often signals bearish market sentiment, while a falling VIX reflects confidence and reduced risk aversion. - Example:
In March 2020, the VIX surged above 80, the highest since the 2008 financial crisis – indicating extreme fear. The market bottomed shortly after, providing contrarian traders with massive upside.
3. Advance-Decline Line (A/D Line)
- What It Measures:
The difference between the number of advancing stocks and declining stocks within an index. - How to Read It:
- Rising A/D Line: Broad participation in market rallies → Confirms bullish sentiment.
- Falling A/D Line: Fewer stocks leading gains → Warns of weakening momentum.
- Why It Matters:
It helps distinguish between healthy rallies (broad-based) and fragile ones (driven by a few big stocks). Traders use it to confirm the strength of bullish or bearish moves.
4. AAII Investor Sentiment Survey
- What It Measures:
A weekly survey by the American Association of Individual Investors that tracks retail investor outlooks: bullish, neutral, or bearish. - How to Read It:
- High Bullish Readings: Can indicate overconfidence → Potential contrarian sell signal.
- High Bearish Readings: Suggest panic or capitulation → Potential buy signal.
- Why It Matters:
Retail traders are often late to trends. When bullish readings are extreme, markets are often near tops; extreme bearish readings often mark bottoms.
5. Commitment of Traders (COT) Report
- What It Measures:
Published weekly by the CFTC, it shows how hedge funds, commercial traders, and speculators are positioned in futures markets. - How to Read It:
- Commercial Traders (Smart Money): Typically hedging risk; often move opposite the crowd.
- Large Speculators: Often trend-followers; extreme positioning can signal reversals.
- Why It Matters:
Spotting imbalances in positioning gives traders insights into where sentiment extremes may cause price reversals.
6. Social Media & News Sentiment Analysis (Modern Approach)
- What It Measures:
Uses AI-driven tools to analyze tweets, headlines, and search trends for sentiment signals. - Why It Matters:
In today’s environment, sentiment can shift in seconds due to viral news or social trends. Monitoring platforms like Twitter, Reddit, and Google Trends can help identify early momentum before price reacts, running automated sentiment scanners on a reliable Forex VPS for 24/7 real-time analysis. - Example:
Meme stocks like GameStop (GME) and AMC in 2021 surged largely due to social-driven bullish sentiment, not fundamentals.
7. Combining Sentiment Indicators for Better Signals
No single indicator tells the full story. Professional traders combine multiple tools to avoid false signals:
| Indicator | Primary Use | Best For |
|---|---|---|
| Put-Call Ratio | Gauging option trader positioning | Contrarian setups |
| VIX | Measuring overall fear/volatility | Timing reversals |
| A/D Line | Confirming rally strength | Stock & index traders |
| AAII Survey | Understanding retail sentiment | Contrarian setups |
| COT Report | Tracking institutional positions | Futures & forex traders |
| Social Sentiment | Capturing fast-moving trends | Short-term trading |
Different Types of Sentiment
Market sentiment isn’t always purely bullish or bearish – it exists on a spectrum. At any given moment, traders, investors, and institutions can have conflicting outlooks based on timeframes, sectors, or asset classes. Understanding the different types of sentiment helps you interpret price action, manage risk, and anticipate potential market shifts.
1. Bullish Sentiment
- Definition:
A positive market outlook where traders expect prices to rise and are more willing to buy risk assets. - Characteristics:
- High investor confidence
- Increased trading volumes
- Rising demand for equities, commodities, or currencies
- Fewer short positions in the market
- Signals & Indicators:
- Rising Advance-Decline Lines → More stocks participating in rallies.
- Low VIX → Calm, confident market.
- High call option activity relative to puts.
- Example:
In late 2020, after stimulus programs and vaccine rollouts, U.S. equities surged to record highs, showing strong bullish sentiment despite ongoing pandemic uncertainty. - Trader Insight:
Bullish sentiment can support uptrends, but extreme optimism often leads to overbought markets and increased correction risk.
2. Bearish Sentiment
- Definition:
A negative market outlook where traders expect prices to fall and seek safer assets or short positions. - Characteristics:
- Widespread pessimism
- Increased selling pressure
- Declines in stock indices, high-yield currencies, and risk assets
- Flight to safe-haven assets like gold, bonds, or USD
- Signals & Indicators:
- Spiking VIX levels → Rising fear and volatility.
- High Put-Call Ratios → Traders buying downside protection.
- Falling market breadth → Gains concentrated in fewer stocks.
- Example:
In March 2020, when global lockdowns began, fear dominated markets, causing the S&P 500 to drop ~34% in just one month – a textbook display of bearish sentiment. - Trader Insight:
Bearish conditions can fuel trend continuations lower, but when pessimism reaches extremes, contrarian traders often find buying opportunities.
3. Neutral / Sideways Sentiment
- Definition:
A state where the market lacks a clear bullish or bearish bias, often leading to range-bound price action. - Characteristics:
- Conflicting economic signals
- Low conviction among traders
- Price consolidations after large moves
- Volatility drops below historical averages
- Signals & Indicators:
- Low trading volumes on both up and down days.
- Narrow price ranges on major indices.
- Mixed option positioning, reflecting indecision.
- Example:
Throughout much of 2015, the S&P 500 traded within a tight range as markets awaited the U.S. Federal Reserve’s first rate hike since 2006 – sentiment stayed neutral until policy clarity emerged. - Trader Insight:
Neutral sentiment environments favor range trading strategies rather than breakout plays. Patience is key while waiting for directional momentum to return.
4. Mixed or Diverging Sentiment
Sometimes sentiment differs between:
- Asset Classes: Stocks may be bullish while bonds signal caution.
- Sectors: Tech stocks might rally while energy sells off.
- Timeframes: A day trader sees short-term bearish setups, but investors remain bullish long-term.
Example:
In 2022, U.S. stock market sentiment turned bearish due to rate hikes, but energy stocks surged to multi-year highs as oil prices spiked – a clear case of diverging sentiment within the same market.
5. Why Sentiment Types Matter for Traders
| Sentiment Type | Market Behavior | Best Trading Style | Key Risk |
|---|---|---|---|
| Bullish | Strong uptrends, breakouts | Trend-following long trades | Buying tops if optimism is extreme |
| Bearish | Sustained downtrends | Short-selling, safe-haven trades | Capitulating too late near bottoms |
| Neutral | Range-bound consolidation | Range trading & mean reversion | Getting chopped in sideways markets |
| Mixed | Diverging price action | Sector rotation strategies | Misreading conflicting signals |
Impact of News, Social Media & AI on Sentiment
Market sentiment today moves faster than ever. In the past, trader behavior was largely driven by earnings reports, economic releases, and central bank policy updates. But now, a single tweet, viral Reddit post, or breaking headline can spark price swings within seconds.
Understanding how news, social platforms, and AI tools influence sentiment helps traders anticipate volatility and react faster.
1. The Role of News in Driving Sentiment
Financial markets are extremely sensitive to headlines. Even before deep analysis, investor expectations often react instantly to key news:
Examples of News That Shape Sentiment:
- Economic Reports: NFP, CPI, GDP, and PMI releases can flip market sentiment within minutes.
- Central Bank Announcements: Hawkish or dovish tones from the Fed, ECB, or BOE often drive huge moves in forex and indices.
- Geopolitical Events: Wars, sanctions, energy crises, or trade agreements shift global sentiment instantly.
- Earnings Surprises: Better- or worse-than-expected company earnings frequently trigger sector-wide sentiment shifts.
Example:
In August 2022, when U.S. CPI inflation came in lower than forecast, risk sentiment surged immediately – stocks rallied, the USD weakened, and bond yields dropped within minutes.
Trader Insight:
Set up economic calendars and real-time alerts to react quickly. Even if you’re not trading the news directly, knowing when volatility spikes are likely helps manage risk.
2. Social Media’s Growing Influence on Sentiment
Platforms like Twitter (X), Reddit, and TikTok have become powerful sentiment engines. Retail traders now organize, share, and amplify trades faster than institutional reports can catch up.
How Social Media Shapes Markets:
- Reddit’s WallStreetBets (WSB): Sparked the GameStop (GME) and AMC rallies in early 2021, causing 1000%+ price surges despite weak fundamentals.
- Twitter & Crypto: Elon Musk’s tweets about Dogecoin repeatedly caused double-digit spikes within minutes.
- Meme Stocks & Viral Narratives: Social momentum often detaches price from fundamentals, creating short-lived sentiment-driven bubbles.
Trader Insight:
Monitor trending tickers and sentiment-driven keywords using tools like:
- Reddit trackers (e.g., ApeWisdom, SwaggyStocks)
- Twitter sentiment monitors
- Google Trends for spike detection
Caution:
Social-driven rallies can reverse violently. Trade smaller positions or use trailing stops when participating in viral moves.
3. AI-Powered Sentiment Analysis – A Game-Changer
With information flowing at unprecedented speed, AI-driven tools now analyze millions of data points in real time to track sentiment shifts before price action fully reacts.
How AI Measures Sentiment:
- News Scanning: Tools like Bloomberg Terminal, Refinitiv Eikon, and AlphaSense process thousands of headlines per second, flagging sentiment shifts.
- Social Listening: AI tracks posts across Reddit, Twitter, and even TikTok to gauge crowd bias.
- Machine-Learning Scoring: AI assigns bullish, bearish, or neutral scores to assets based on aggregated sentiment data.
Practical Use for Traders:
- Short-Term Traders: Use AI-driven dashboards to spot unusual buzz before price spikes.
- Swing Traders: Track sentiment divergence – if sentiment remains negative while prices rise, a pullback may be near.
- Investors: Combine AI sentiment scores with fundamentals to filter hype-driven noise from sustainable trends.
4. The Feedback Loop Between Sentiment & Price
News and social-driven sentiment create self-reinforcing market cycles:
- Breaking News or Viral Post → Sentiment spikes bullish or bearish.
- Traders React → Price moves rapidly.
- Momentum Amplifies Online → Social media drives more traders into the trend.
- Price Overshoots Fundamentals → Sentiment eventually normalizes → Reversals follow.
Example:
The Silicon Valley Bank (SVB) collapse in March 2023 spread rapidly on Twitter, causing bank stock panic selling before traditional media even broke the story.
Best Practices for Traders
| Strategy | Why It Matters | Practical Tip |
|---|---|---|
| Monitor Real-Time News | Stay ahead of sentiment shifts | Use calendars + alerts for economic events |
| Track Social Buzz | Detect retail-driven volatility | Follow Reddit WSB & trending tickers |
| Use AI Sentiment Tools | Process info faster than humanly possible | Platforms like TradingView, LunarCrush, or StockTwits sentiment feeds |
| Manage Risk | Viral-driven moves reverse quickly | Use tight stops & smaller sizes on hype-driven trades |
FAQs
What is market sentiment?
Market sentiment refers to the overall outlook or mood of the investors towards a specific stock or the market in general at any given time.
How does market sentiment affect stock prices?
Market sentiment drives the demand and supply of stocks in any market, which in turn leads to price movements. When the sentiment is pessimistic, prices are likely to go down. Conversely, optimistic sentiments will cause stock prices to rise.
What is the difference between bullish and bearish sentiment?
A market is described as having bullish sentiment when prices are rising and investors are optimistic. Conversely, a bearish sentiment indicates waning investor confidence and is characterized by continuously declining prices.
How can I analyze market sentiment?
Technical indicators are used to analyze and measure market sentiments. You can also look at price movements, and put or call ratios, and analyze the impact of market news on investor emotions.
What are the best market sentiment indicators?
Some of the best market sentiment indicators include Commitment of Traders, Volatility Index, Bullish Percent Index, and Moving averages.
How does sentiment analysis influence trading decisions?
Sentiment analysis can be useful for identifying current trends and potential reversals. It is a valuable tool for identifying trading opportunities and managing your risks as a trader.