The hammer is a popular single-candle pattern traders typically use to identify potential reversals on a chart. Named after its distinctive visual resemblance to an actual hammer, this candle can be quite valuable in predicting market movements and working out your trading strategy. Read on as we explore the concept of hammer candlesticks, how to identify them and how to incorporate them into your trading strategy.
Introduction to Hammer Candlesticks
When it shows up on a chart, the hammer candle is typically interpreted as a reversal pattern. It is formed when the price of a traded asset falls significantly lower than the opening price, but rallies within the trading period so it closes near the opening price (either above or below the opening). This kind of price trend suggests that the market is trying to determine a bottom.
The Hammer candlestick is a sign that there has been a possible change in the market trend. The long shadow means the market rejected a significant pressure to sell, so a potential trend reversal to the upside is imminent.
Identifying Hammer Candlestick Patterns
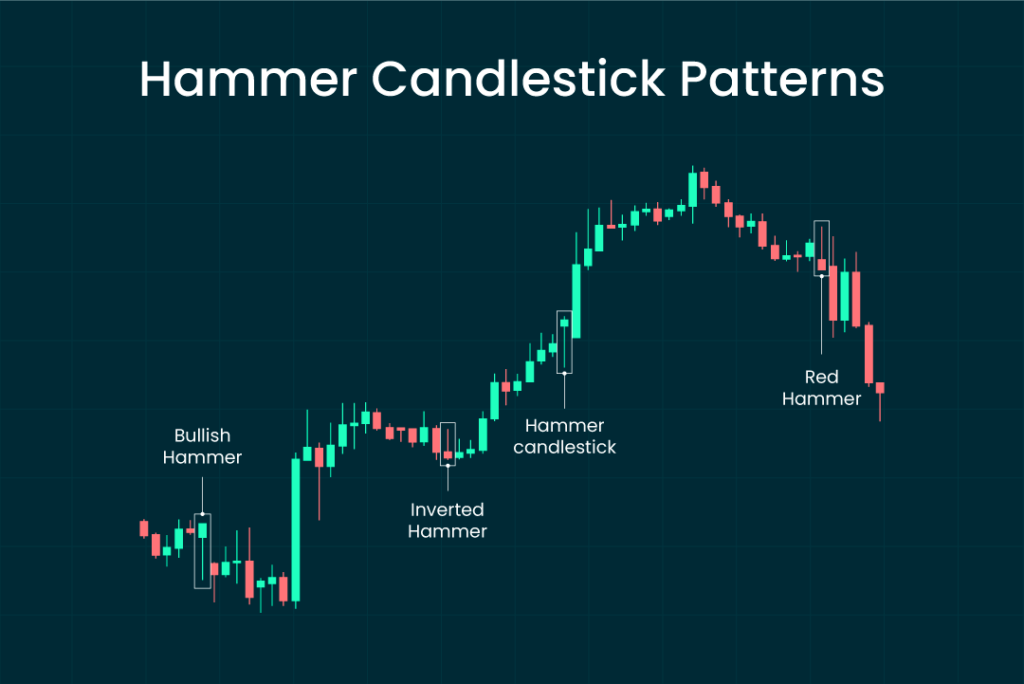
You should have no trouble recognizing the hammer candlestick. As the name suggests, the candlestick looks very much like an actual “hammer” or the letter “T”. This type of shape is formed by a small candlestick body with a long wick or shadow. The wick is typically twice as long as the candle’s body. Hammer candles also tend to have a short upper shadow. This implies that there was limited buying interest after the rejection of selling pressure.
The hammer candle has an appearance closely similar to the “Doji candle”. However, it has a longer and more prominent body compared to the Doji, which is often so short that it almost looks like a horizontal line. Both green and red hammers can be found on charts. The green color means the market trend is strongly bullish, while the red color means the bullish run is weaker.
Understanding Inverted Hammer Candlesticks
If you turn the hammer candlestick upside down, what you get is the inverted hammer. This means the candle will have a long upper shadow and a short body. The wick is typically twice as long as the body, while the closing and opening prices are all near the same level at the bottom of the candle. The inverted hammer candle indicates a significant rejection of buying pressure, which could lead to a potential reversal to the downside.
Bullish Hammer Candlesticks Explained
Technically, both green and red hammer candlesticks are considered bullish signals. However, the green bullish hammer candle is considered a stronger signal as it indicates the bulls have a stronger potential to overpower the bears during the trading session. Consequently, the green bullish hammer candlestick is often taken as a stronger trading signal compared to the red.
Significance of Red Hammer Candlesticks
In technical analysis, the color red signifies high selling pressure in the market. However, in the case of a red hammer candlestick, the market is still bullish despite the selling pressure. The long lower shadow of this candle indicates that the buyers ultimately rejected the selling pressure and the market stayed bullish.
Using Hammer Candlesticks to Predict Market Movements
A hammer candlestick typically appears after a price decline (at the bottom of a downtrend). When this occurs, it signals a potential reversal to a bullish market, with the buying pressure overcoming the selling pressure.
However, this reversal to the upside will only be confirmed if the candle following the market prediction hammer candlestick closes above the hammer’s closing price, indicating strong buying. Generally, it is recommended to wait for this confirmation before entering a trade.
Incorporating Hammer Candlesticks into Your Trading Strategy
Incorporating hammer candlesticks into your trading strategy depends on your risk aversion. Traders with a high-risk appetite typically take a trading position as soon as they see a hammer pattern form in anticipation of a trend reversal. In this case, the hammer’s closing price is taken as the entry point to the trade while its low price is used as the stop loss. However, traders with a low-risk appetite will typically wait for the next two to three candles to confirm the trend reversal.
Most traders use a hammer candlestick strategy as an indicator to enter a long trade. However, it could serve as a signal to exit a short position on a downtrend before the trend reverses. Note that when trading with hammer candlesticks, the appearance of a hammer candle does not guarantee a trend reversal. The market can still continue to move in its current direction after a hammer signal appears which is why it is always best to wait for a confirmation.
Frequently Asked Questions
What is a hammer candlestick?
A hammer is a bullish candlestick pattern characterized by a short body and a long lower shadow (typically two or three times the length of the body).
How do you identify a hammer candlestick pattern?
The hammer candlestick is a single candle shaped like a hammer or the letter “T” ” It is characterized by a short body, a long lower shadow and a short upper shadow.
What does an inverted hammer candlestick indicate?
An inverted hammer candlestick has a long upper shadow indicating a rejection of buying pressures, which leads to a potential reversal to the downside.
How is a bullish hammer candle used in trading?
A bullish hammer candle in a downtrend is considered a sign of a potential trend reversal. Traders can take this as an indicator to enter a long trade or as a sign to exit a short.
What is the difference between a red hammer candlestick and a green one?
Red and green hammers are both bullish trend reversal patterns. However, the red color implies that the selling pressure was still greater than the buying pressure during the trading period. Consequently, the green signal is considered a stronger bullish signal than the red.
Can hammer candlesticks predict market reversals?
Yes, hammer candlesticks are good indicators of a potential market reversal. It suggests a change in market sentiments leading to buyers gaining control.
How do hammer candlesticks fit into a trading strategy?
Hammer candlesticks can be used to identify potential trend reversals. Consequently, they can be used as an indicator to enter or exit a trade. It can also be used to manage risks in trading such as setting stop-loss orders and limiting your position size.