
Candlestick patterns have become an integral part of trading as they help traders monitor market prices and daily trends. Among the different types of candlesticks is the doji, which serves as a symbol of indecision and uncertainty in the market. This guide will cover doji candles, their different types, and their roles in stock trading, along with practical tips.
Introduction to Doji Candles
When a market’s opening price is equal or nearly matches its ending price, then it has produced what is known as doji candlestick pattern; hence it takes on a cross-like shape. During this short period, buyers and sellers meet, thus indicating potential indecision in the particular market place.
A doji has a thin body, which may look like a line, but its upper and lower shadows may vary in lengths. Doji patterns are significant indicators when it comes to technical analysis because they frequently suggest either a change of trend or an eventual reversal of trends found within the market. In any case, traders who wish to improve their analysis skills need to first comprehend what doji candles entail and how they work.
Identifying Different Types of Doji Candles
Doji candles come in many different variations, each with its distinct characteristics that carry unique meanings. By being able to distinguish between various types of Doji candles, traders may be better positioned to grasp market signals leading to informed decisions.
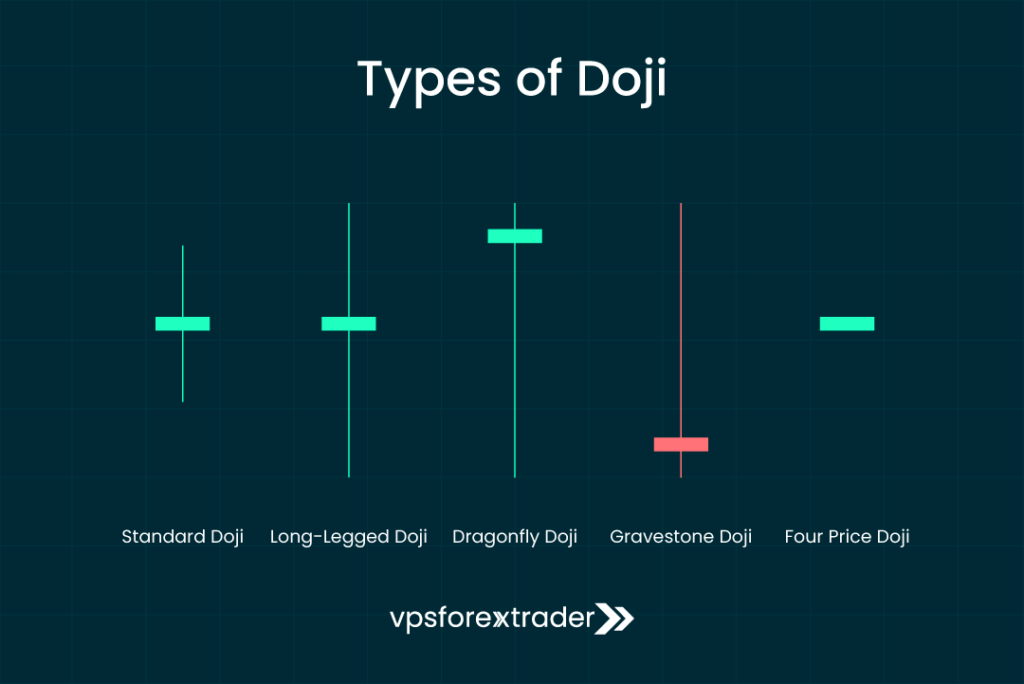
Standard Doji
A plain model of a doji is characterized by having a very thin body that has equal upper and lower shadows. It represents a scenario where buying pressures equal selling pressures and can be found in an upward or downward trend.
Long-Legged Doji
This pattern has longer upper and lower shadows; this shows considerable degree of uncertainty in the market. Suggesting that the market faced great fluctuations but eventually ended up closing close to its opening price.
Dragonfly Doji
This pattern is characterized by a long lower shadow but has no or very little upper shadow. If such a situation occurs, it denotes that potential bullish sentiment is present within the session since opening by session low and closing by session high were not distinguished as different events.
Gravestone Doji
It is quite the reverse of dragonfly doji which features a long upper shadow with almost none on the lower side. It occurs when price points are extremely low at market openings and closings suggesting bearish sentiments could exist there.
Four Price Doji
These are rare patterns which do not possess any shadows basically resembling just one horizontal line thus indicating that volatility in this case tends towards being virtually nonexistent or barely detectable presence suggesting indecisiveness within our entity under discussion here today.
Doji vs Other Candlestick Patterns
To avoid confusion, let’s compare the Doji with similar-looking patterns:
| Pattern | Body Size | Wick Size | Signal Type |
|---|---|---|---|
| Doji | Very Small | Medium to Long | Indecision |
| Spinning Top | Small | Long (both sides) | Indecision |
| Hammer | Small | Long lower wick | Bullish reversal |
| Shooting Star | Small | Long upper wick | Bearish reversal |
The Role of Doji Candles in Stock Trading
Amid trading stocks, such mirrors are significant as they provide signals for variations, altering the examination of the trader in such a way that he incorporates the factors relevant to performing this task. Doji candles are especially useful in volatile markets where prices change rapidly, which create chances for traders.
Doji patterns within stock trading can act as the earliest alarms for probable reversals or continuations. This way, by observing the appearance of Doji candles and analyzing their context traders can change their strategies and make profits from market dynamics.
What do Doji candles signal?
The power of the Doji lies in context.
In an Uptrend:
- May signal bull exhaustion
- Potential trend reversal or short-term correction
- Stronger if followed by a bearish candle (confirmation)
In a Downtrend:
- May signal bear exhaustion or buying pressure emerging
- Look for follow-up bullish candles
In Consolidation:
- Pay attention to volume and surrounding candles
- Could indicate indecision before a breakout
How to Trade a Doji Candle
Trading Doji candles successfully involves patience and confirmation.
1. Wait for Confirmation
- Do not enter based on a Doji alone
- Look for the next candle to break support/resistance
2. Use Supporting Indicators
- RSI: Confirms overbought/oversold context
- MACD: Shows momentum shift
- Volume: Surge indicates conviction
3. Plan Entry, Stop-Loss, and Take-Profit
- Entry: After confirmation candle closes
- Stop-Loss: Below the Doji low (for long), above high (for short)
- Target: Nearby support/resistance or risk-reward multiple
How to Use Doji Candles to Predict Market Reversals
Doji candles are powerful tools for predicting market reversals, especially when combined with other technical indicators. To use Doji candles effectively in predicting reversals, traders should consider the following:
- Context Matters: Assess the overall trend and market conditions before interpreting a Doji pattern. A reversal Doji candlestick in an uptrend may suggest a bearish reversal, while in a downtrend, it may indicate a bullish reversal.
- Confirm with Other Indicators: Use additional technical indicators, such as moving averages or RSI, to confirm potential reversals suggested by Doji patterns.
- Look for Confirmation Candles: After a Doji appears, wait for the next candlestick to confirm the reversal signal. A bullish or bearish candlestick following a Doji can provide stronger evidence of a market shift.
By understanding how bullish and bearish Doji patterns function, traders can anticipate potential reversals and adjust their positions accordingly.
Case Study: What Happened After a Doji on Tesla (TSLA)
Context
On February 21, 2024, Tesla (TSLA) printed a Gravestone Doji on the daily chart following a sharp three-day rally, closing near $206 after reaching a high of nearly $212 during the session. The Gravestone Doji appeared at a known resistance zone from November 2023—an area previously associated with seller dominance.
Technical Snapshot:
- Candle Type: Gravestone Doji
- Chart Timeframe: Daily
- Volume: Above average (increased selling pressure)
- Indicators:
- RSI: Hovering near 68 (approaching overbought)
- MACD: Bullish but flattening histogram
- Support/Resistance: Sitting below $212 resistance
Market Reaction
The day after the Doji, TSLA opened lower and printed a strong bearish engulfing candle—confirming the reversal signal. Over the next 5 trading sessions, the stock declined approximately 7.4%, falling from $206 to around $191 before stabilizing.
Trade Setup (Hypothetical)
- Entry: Short at $204 after confirmation candle
- Stop-Loss: $212 (above Doji high)
- Target: $192 (prior minor support zone)
- Risk/Reward: ~1:1.5
Lessons Learned
- The Gravestone Doji, when aligned with overbought conditions and resistance levels, can strongly signal exhaustion in bullish momentum.
- Confirmation is key—traders who acted on the Doji alone without waiting for follow-through risked false signals.
- Using volume and RSI helped increase the credibility of the setup.
Examples of Doji in the Market
Here are two real-world examples to illustrate how Doji candles behave.
Example 1: Successful Reversal in EUR/USD
- Location: After a strong downtrend
- Pattern: Dragonfly Doji
- Confirmation: Bullish engulfing candle
- Result: +120 pip rally in 3 days
Example 2: Failed Signal on BTC/USD
- Location: At the top of an uptrend
- Pattern: Gravestone Doji
- No strong bearish follow-up
- Result: Sideways movement, false reversal
Practical Tips for Trading with Doji Candles
Trading with Doji candle patterns requires a strategic approach to maximize their effectiveness. Here are some practical tips for trading with Doji candles:
- Use Support and Resistance Levels: Doji patterns are more reliable when they occur near significant support or resistance levels. These levels can provide additional context and increase the likelihood of a successful trade.
- Combine with Other Patterns: Pair Doji candles with other candlestick patterns, such as the hammer Doji, to strengthen trade signals and improve decision-making.
- Set Stop Losses: Always use stop losses when trading Doji patterns to protect against unexpected market movements and minimize potential losses.
- Stay Informed: Continuously monitor market news and developments, as external factors can influence market sentiment and impact Doji patterns.
By incorporating these tips into their trading strategies, traders can enhance their ability to use Doji candles effectively and improve their overall trading performance.
Common Mistakes When Trading Doji
Many traders misuse Doji signals. Here’s what to avoid:
- Assuming every Doji means reversal
- Ignoring market structure or trend context
- Entering without confirmation
- Confusing Doji with spinning tops or other patterns
FAQ
What is a Doji candle?
A Doji candle is a candlestick pattern characterized by its minimal body, indicating that the opening and closing prices are equal or nearly equal. It represents indecision in the market and can signal potential trend reversals or continuations.
What does a Doji candle indicate in trading?
In trading, a Doji candle indicates a state of equilibrium between buyers and sellers. It suggests indecision in the market, often signaling a potential change in trend or a continuation of the current trend.
How can I identify a Doji candlestick pattern?
To identify a Doji candlestick pattern, look for a candlestick with a small or nonexistent body and upper and lower shadows of varying lengths. The opening and closing prices should be nearly equal.
What are the different types of Doji candles?
The different types of Doji candles include the Standard Doji, Long-Legged Doji, Dragonfly Doji, Gravestone Doji, and Four Price Doji. Each type has unique characteristics and implications.
How is a Doji candle used in technical analysis?
In technical analysis, a Doji candle is used to identify potential trend reversals or continuations. It serves as a warning signal, alerting traders to the possibility of a market shift.
What is the significance of a Doji in stock trading?
In stock trading, a Doji is significant because it can signal potential changes in market sentiment. Traders use Doji patterns to anticipate reversals or continuations and adjust their strategies accordingly.
Can a Doji candle predict market reversals?
While a Doji candle cannot predict market reversals with certainty, it serves as an important indicator of potential trend changes. When combined with other technical indicators and analysis, Doji patterns can help traders anticipate reversals and make informed decisions.
Sources
https://www.tdameritrade.com/tools-and-platforms/thinkorswim.html
https://www.investopedia.com/terms/d/doji.asp